The posts that
got clients.
I’ve published over 5,000 posts. These are the ones I can trace to sales, enquiries and audience growth, for me and for my clients. Each one broken down: the graph, the date and the lesson.
Real client work, my own content data and practical lessons from 30 Hormozi videos.
One payment. 19-page PDF + editable worksheet.
Download from the Stripe confirmation screen.
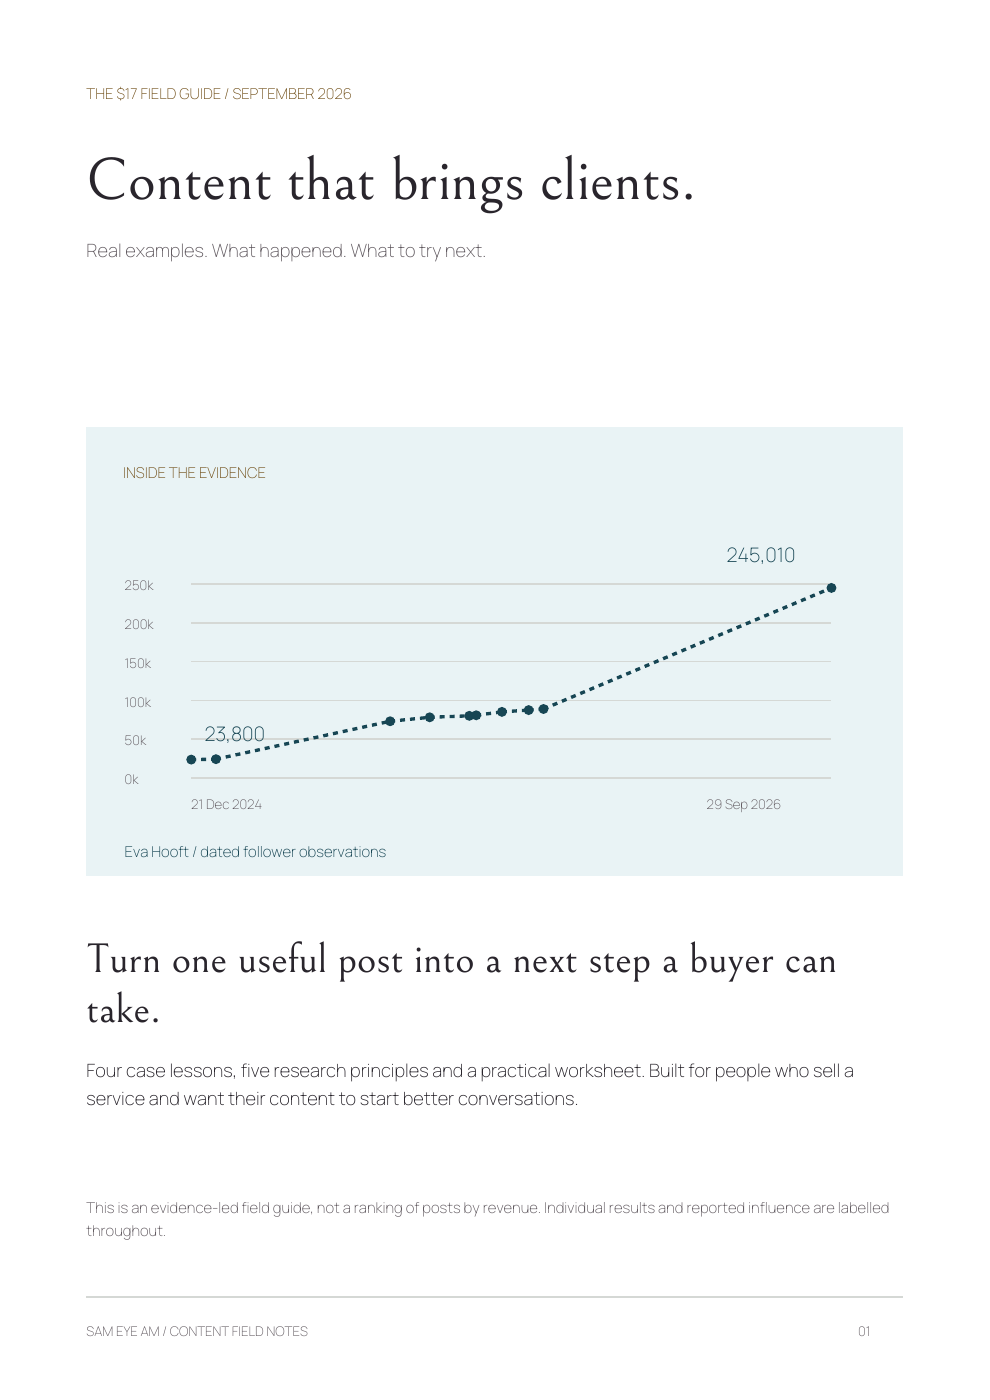
Eva Hooft / the dated record
See the change.
Keep the dates.


Drag to compare
INSTAGRAM FOLLOWERS · OBSERVED SNAPSHOTS
Move over the graph or tap to explore. Use ← → on a keyboard.
Work began in December 2024 and included later projects and support. These observations show the timeline; they do not isolate the effect of our work.
Dates, source notes and the limits
Dots are recorded observations. Dashed lines connect gaps, not daily measurements. The first screenshot is two days after work began. Eva attributed a January 2025 overnight spike to press coverage; later growth has several possible influences. This is not a claim of continuous delivery or revenue.
| Date | Followers |
|---|---|
| 21 Dec 2024 | 23,800 |
| 15 Jan 2025 | 24,345 |
| 10 Jul 2025 | 73,200 |
| 19 Aug 2025 | 78,300 |
| 28 Sep 2025 | 80,200 |
| 05 Oct 2025 | 80,900 |
| 31 Oct 2025 | 85,300 |
| 27 Nov 2025 | 87,600 |
| 12 Dec 2025 | 89,000 |
| 29 Sep 2026 | 245,010 |
The slider shows the December 2024 and October 2025 captures. The final graph point is a later public observation on 29 September 2026.
Justin Thompson
He started
publishing.
We worked on his content, recording setup and production process. The useful lesson: make your expertise easier to show.
Client-reported sales. Values and collected payments are unknown. The daily publishing habit did not persist.
What this comparison shows
The images show a change in recording setup, not a controlled revenue experiment. They do not isolate the effect of equipment. Read the case ↗


Drag to compare
Sam’s content / trace the response
A post is only
the first step.
The 21 October 2025 Reel has 7 recorded leads linked to the post. Their collected revenue is unknown.
From the wider archive
What earned attention?
Mean engagement percentile · published Instagram posts
Move over the graph or tap to explore. Use ← → on a keyboard.
How to read this chart
3 topic groups shown from 527 measured feed posts. The scale compares engagement within this study; 57.8 is a percentile score, not a 57.8% conversion rate. Trial posts are separate. Engagement does not establish sales. Snapshot: 29 September 2026.
Inside your download
Take the lesson
into your next post.
The examples
Eva, Justin, an anonymous technique demonstration and my own post-to-lead evidence.
What to try
A demonstration template, a clearer invitation and a 4-post experiment.
Your worksheet
Trace one post through an enquiry and the next step. Printable and editable.
The research behind the report
Post records include trials and cross-posts. Call records come from a deduplicated subset; not every call was fully reviewed. Client-post coverage is incomplete. We collected the English captions and inspected relevant timestamped passages from 30 distinct videos on Alex Hormozi’s own channel. The report includes an original synthesis and source links, not redistributed transcripts or audited financial claims. No endorsement is implied.
Download and put it to work
Make your next post
easier to act on.
19-page report + editable worksheet.
A practical starting point for people who sell a service.
Specific examples and reported outcomes, with their limits. This is not a complete ranking of posts by revenue.
USD · one-time payment
The posts, broken downPay securely through Stripe. Your confirmation screen includes the ZIP download.
How do I get the files?
After a successful card payment, Stripe shows the download link for a ZIP containing the PDF report and editable Markdown worksheet. Save it before closing the screen. You do not need an account or a subscription. For an access problem, contact us with your Stripe receipt.
Does this rank posts by money made?
The available records do not support a complete revenue ranking. You get the examples with traceable enquiries and reported sales, what changed, and a method for measuring your own results without treating views as money.